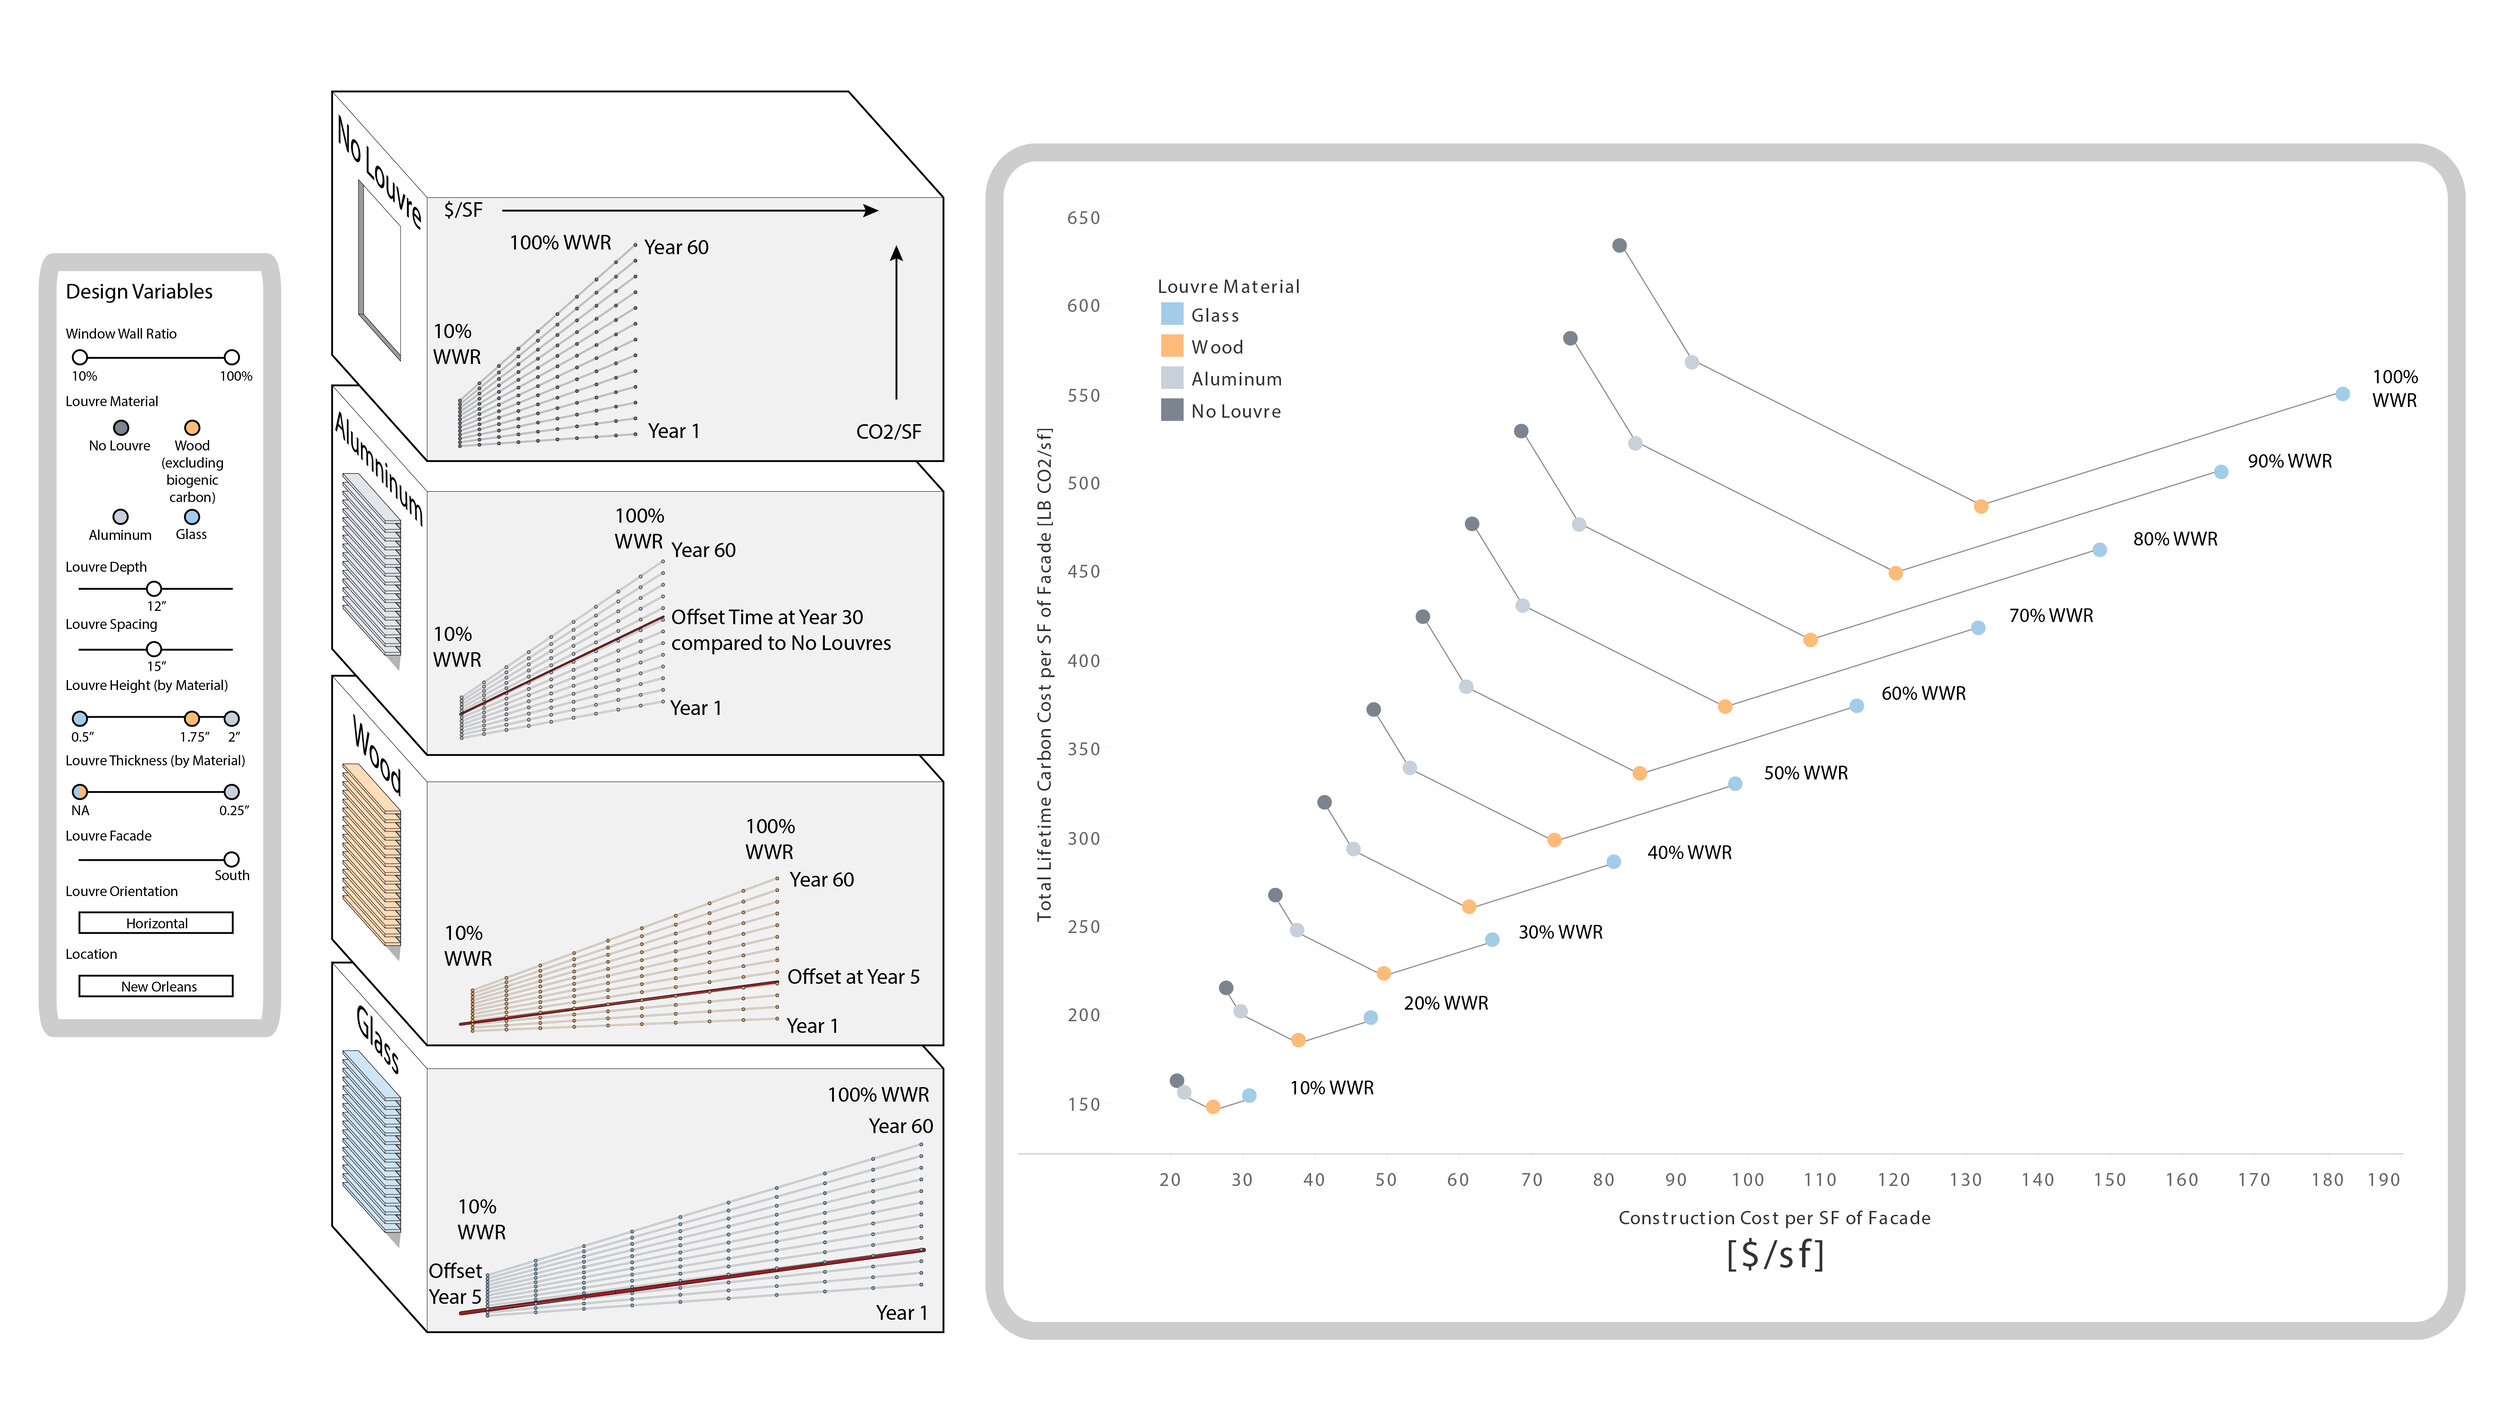
Communicating Complex Design Decisions Graphically: Louvres and Carbon

Lifetime Carbon Intensity and Cost Efficiencies of Louvre Assemblies with Different Window Wall Ratios
*Graphics displayed represent a South-Facing Facade, in New Orleans, with 12” deep louvres, spaced at 15” vertically.
Project StaSIO selected this graphic among many submittals as a finalist, and EDR will be presenting it at the ASHRAE Conference in Denver on Wednesday, September 27. The competition aims to encourage architects and energy simulators or experts to discuss data and complex issues with clarity. A successful submittal is a single graphic that “successfully communicates the impact of certain design alternatives on a building’s performance.”
This study aims to bridge the gap between data and design decisions, allowing architects to make informed choices. Though a variety of inputs can be adjusted, the above graphic represents a specific scenario and its results. Analyses can be adjusted with the primary inputs, described below, by the designer. The resulting graphic compares unshaded glazing to one shaded with louvers of aluminum, wood, and glass in terms of cost and energy payback of embodied carbon. A designer can look at the graphic and compare options for cost, window wall ratio, or louver material to conclude which option is best to apply to their facade.
Primary Inputs: Louver Material, Window-Wall Ratio(WWR), Building Lifespan, Louver Sizing and Placement, Location. Secondary Inputs: Carbon intensity of aluminum, wood, and glass louvres by volume, Carbon intensity of assumed cooling necessary to offset conductance and solar heat gain in scenarios with and without louvers
Primary Outputs: Total Lifetime Carbon Cost (Embodied + Operating), Construction Cost, Offset Time when Louvre System is more carbon efficient than no Louvre System
The graphic displays the design variables in the model, how the shoebox model of louvers on facade is laid out, and the final result of the study. The design variable table shows the inputs that generated the results, and they also double as the range of inputs that are available in the parametric grasshopper model. The set of shoebox models show the geometric output of the variables along with respective graphs that detail each louvre material types’ relative carbon intensity and cost efficiency. The time of offset (when the total lifetime carbon footprint of a no louvre system exceeds the carbon footprint of a louvre system) is shown as the time when the slope of carbon values from the no louvre results for a given year exceeds the slope of values for louvre results in the same year.
The final graph forms a quantitative decision tree for selecting a WWR and louvre type to reach carbon and cost benchmarks. The graph charts 4 different variables: total lifetime carbon cost per sq. ft. of the facade assembly (carbon intensity), construction cost per sq. ft. of the facade assembly (cost efficiency), louvre types, and Window-Wall Ratios. By displaying results through two quantitative axes, the graphic allows for decision-making on account of carbon and cost efficiency.
The shoebox model was constructed in Rhino using the inputs as dynamic controls in Grasshopper. A Diva analysis generated the solar heat gain values that were then transferred to an excel sheet with all inputs and constants. The total lifetime carbon was then calculated and graphed in Tableau.
Excel Spreadsheet used for Calculations
Grasshopper Script for Calculating Solar Savings


